
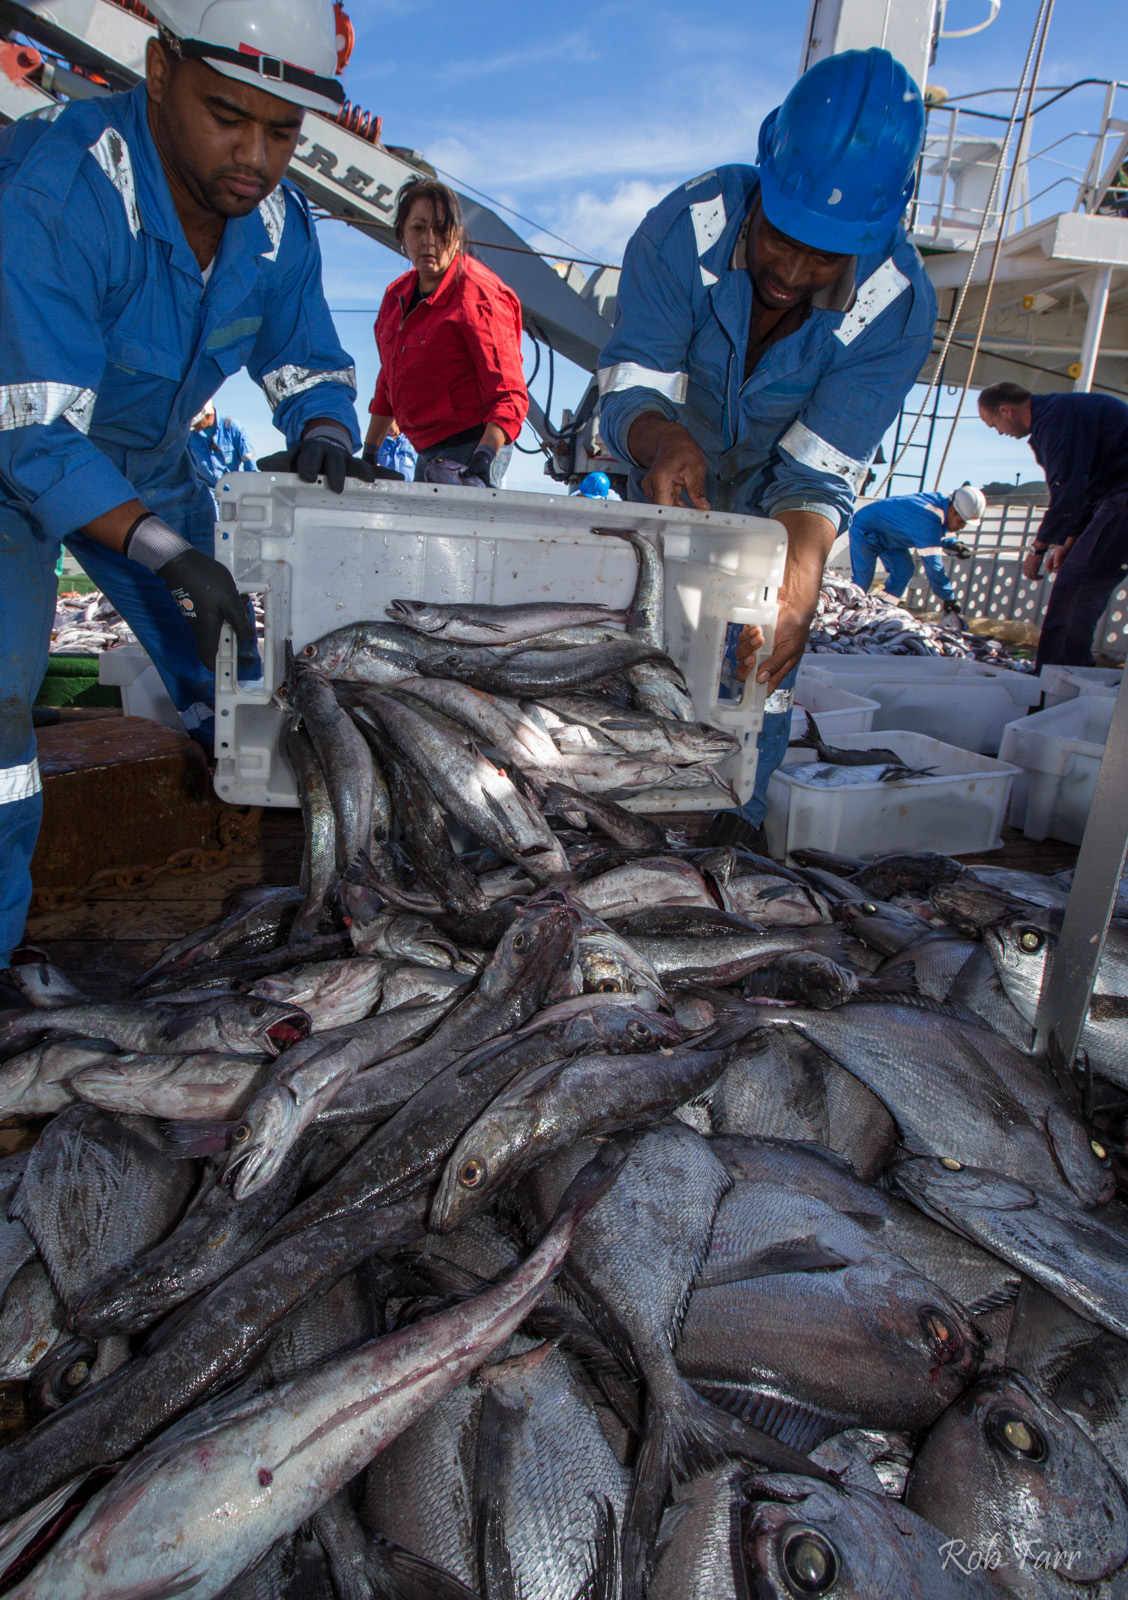
Statistics show transformation in the country’s fishing sector
21 February 2024
A recent briefing by the Commission for Gender Equality to the Portfolio Committee for Forestry, Fisheries and the Environment revealed that Coloureds at all levels of the Department of Forestry, Fisheries and the Environment are underrepresented at 2% while they make up 8.2% of the population.
Member of Parliament, Honourable Nazier Paulsen, used this statistic to publish a claim on Facebook, that “fisheries has always been a major economic activity of the Coloured community and that since the advent of democracy, Coloureds and Africans have increasingly been denied access to the oceans”.
Not only is this claim blatantly untrue, but it is a gross abuse of Parliamentary privilege and represents political grandstanding of the worst kind.
The medium and long-term rights allocations in the commercial fishing sectors achieved significant transformation in the fishing industry measured in terms of black ownership of total allowable catch (TAC) and total allowable effort (TAE).
It is worth highlighting out for instance, that the average black shareholding in the west coast rock lobster nearshore fishery is 93,13%; west coast rock lobster offshore fishery is 90,73%; hake inshore trawl is 89,60% large pelagics is 74,20%; horse mackerel is 84,49%; and patagonian toothfish is 69,17%.
Table 1 FRAP 2015
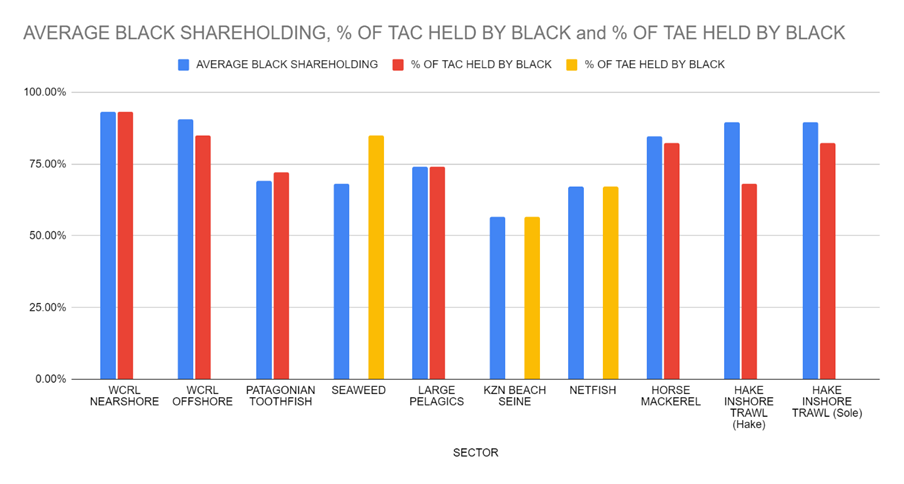
Table 1 FRAP 2021
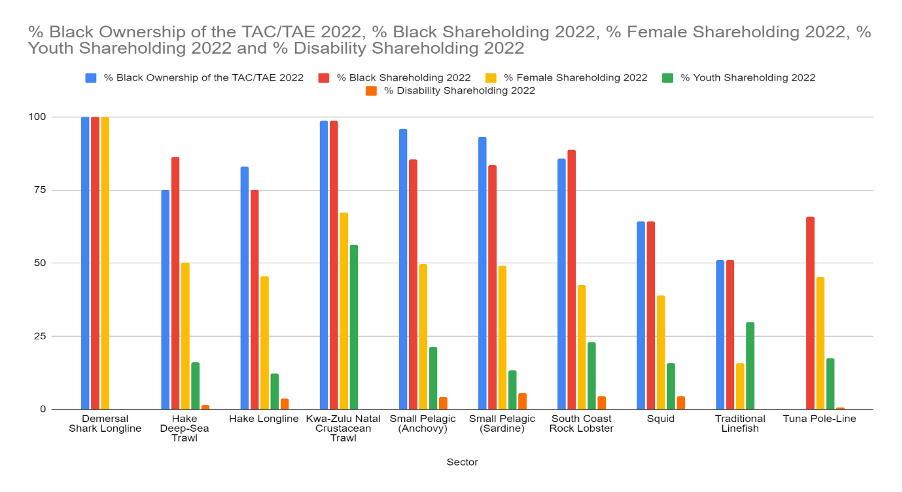
The figures in Table 3, below, demonstrate that the opposite of Hon Paulsen’s claim is true, and that with the exception of traditional linefish, the percentages of African and Coloured ownership and shareholding, as well as those for women and persons with disabilities have improved significantly since fishing rights were first allocated in 2005.
Table 3 below outlines the various transformation profiles from 2005, 2013 where applicable, and 2022.
Shareholding | 2005/2006 | 2013 | 2022 | |
Demersal Shark Longline | Black | - | 81% | 100% |
Female | - | 60% | 100% | |
Youth | - | - | - | |
People with disabilities | - | - | - | |
Hake Deep-Sea Trawl | Black | 80% | - | 86.23% |
Female | 27.55% | - | 50.23% | |
Youth | - | - | 16.13% | |
People with disabilities | - | - | 1.50% | |
Hake Longline | Black | 84.69% |
| 83.33% |
Female | 70.28% |
| 55.39% | |
Youth | - |
| 18.87% | |
People with disabilities | - |
| 3.76% | |
Kwa-Zulu Natal Crustacean Trawl | Black | 63.25% | 67% | 98.64% |
Female | 22% | 39% | 67.25% | |
Youth | - |
| 56.16% | |
People with disabilities | - |
| 0.15% | |
Small Pelagic (Anchovy) | Black | 82.00% | - | 84.68% |
Female | 28.61% | - | 47.40% | |
Youth | - | - | 12.07% | |
People with disabilities | - | - | 3.99% | |
Small Pelagic (Sardine) | Black | 82.00% | - | 82.08% |
Female | 28.61% | - | 48.27% | |
Youth | - | - | 12.06% | |
People with disabilities | - | - | 4.89% | |
South Coast Rock Lobster | Black | 72.00% | - | 85.84% |
Female | 23.00% | - | 35.19% | |
Youth | 0.14% | - | 19.21% | |
People with disabilities | - | - | 0.14% | |
Squid | Black |
| 67.83% | 64.26% |
Female |
| 39.42% | 38.00% | |
Youth |
| 19.74% | 15.95% | |
People with disabilities |
| 4.79% | 4.60% | |
Traditional Linefish | Black |
| 60% | 51% |
Female |
| 6% | 8% | |
Youth |
| 7% | 16% | |
People with disabilities |
| - | 0% | |
Tuna Pole-Line |
|
| 66% | 66% |
|
| 34% | 45.2 | |
|
| - | 17.6% | |
People with disabilities |
| - | 0.8% | |
TOTAL |
|
|
|
|
Northern Cape
Based on the data indicated on the table above, the Northern Cape has a total of 103 declared small-scale fishers. Out of this, a percentage of 80% small-scale fishers who recognise themselves as Coloured. There is a further 15% representing Whites and 5% representing blacks. Noting that the fishing communities are few and are remote, the statistics does reflect the reality of the general coastal communities in the province.
Western Cape
The table above indicates the percentage and total number of declared small-scale fishers per ethnic groups that participated. For Western Cape, it is overwhelmingly clear that majority of small-scale fishers in the Western Cape are made up of 70% Coloured, followed by 25% of blacks. The remaining marginal ethnic groups, according to the figure above, are white and “other” that constitutes 3% and 2% respectively. The figure above does not further define “other”.
Eastern Cape
The Eastern Cape constitutes the highest number of declared small-scale fishers, which is 5335. This is by no surprise, considering the total number of coastal villages and peri-urban areas with fishing communities. In this province, over 99% of declared small-scale fishers recognise themselves as black while 1% is made up of Coloured fishers. The rest of the small-scale fishers’ make up is minuscule.
KwaZulu-Natal
Like the Eastern Cape, KwaZulu-Natal has a percentage of 91 black small-scale fishers, followed by 15% of Indian small-scale fishers. There is a very marginal percentage of white small-scale fishers in the province with no Coloured small-scale fishers. This is based on a total of 2182 declared small-scale fishers in the province.
The demographics, specifically the ethnic composition per province, provides an overall presentation of the general population per province. In this regard, the process of declaring small-scale fishers indicates the transparency and openness of the process followed wherein no specific ethnic group was unfairly treated or marginalised in the process. When both the commercial and small-scale demographic information are considered, it shows that there has been significant transformation in the Fishing sector which contradicts the claims made by Hon Paulsen that Coloureds and Africans have been systematically excluded. In fact, the opposite is true.
For media enquiries, contact:
Peter Mbelengwa
Cell: 082 611 8197